Introduction
About five years ago I had what I thought was an interesting and novel idea – a WiFi connected scoreboard that displays NHL hockey scores in real time. This crossover between my love for hockey and my growing interest in electronics seemed like a perfect project for me at the time. The initial idea was to mimic what you’d see at your local rink, displaying the score for a single game in real time. Think like this:
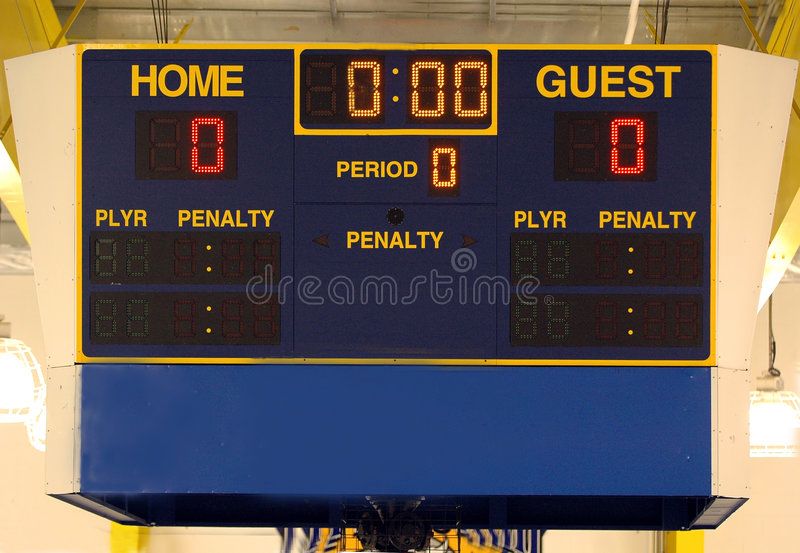
The only requirements I set for myself at the time were that it should run on a Raspberry Pi (as I had recently been given one as a gift), and that it should display the score in as close to real time as possible. Oh, and that it should look cool on a wall!
That project… never came to fruition. At the time, I was in the middle of a busy undergrad, which got in the way of dedicating any real time into it.
Then work got in the way.
Then more school.
Then more work…
You can see where this is going…
This past winter, I decided to finally resurrect this idea. Upon researching the large seven segment displays that would be needed to display the teams and scores, I learned that they can be quite pricy. I also finally admitted that I move fairly often, making a large scoreboard a very impractical thing to own. With both of these in mind, I decided to pivot my idea and potentially make something even cooler. I have always been intrigued by LED matrices, and this seemed like the perfect opportunity to leverage the freedom they allow. My new plan was to make a scoreboard that cycles through today’s NHL games and displays the time remaining and score for each game, along with the team logos and other helpful information.
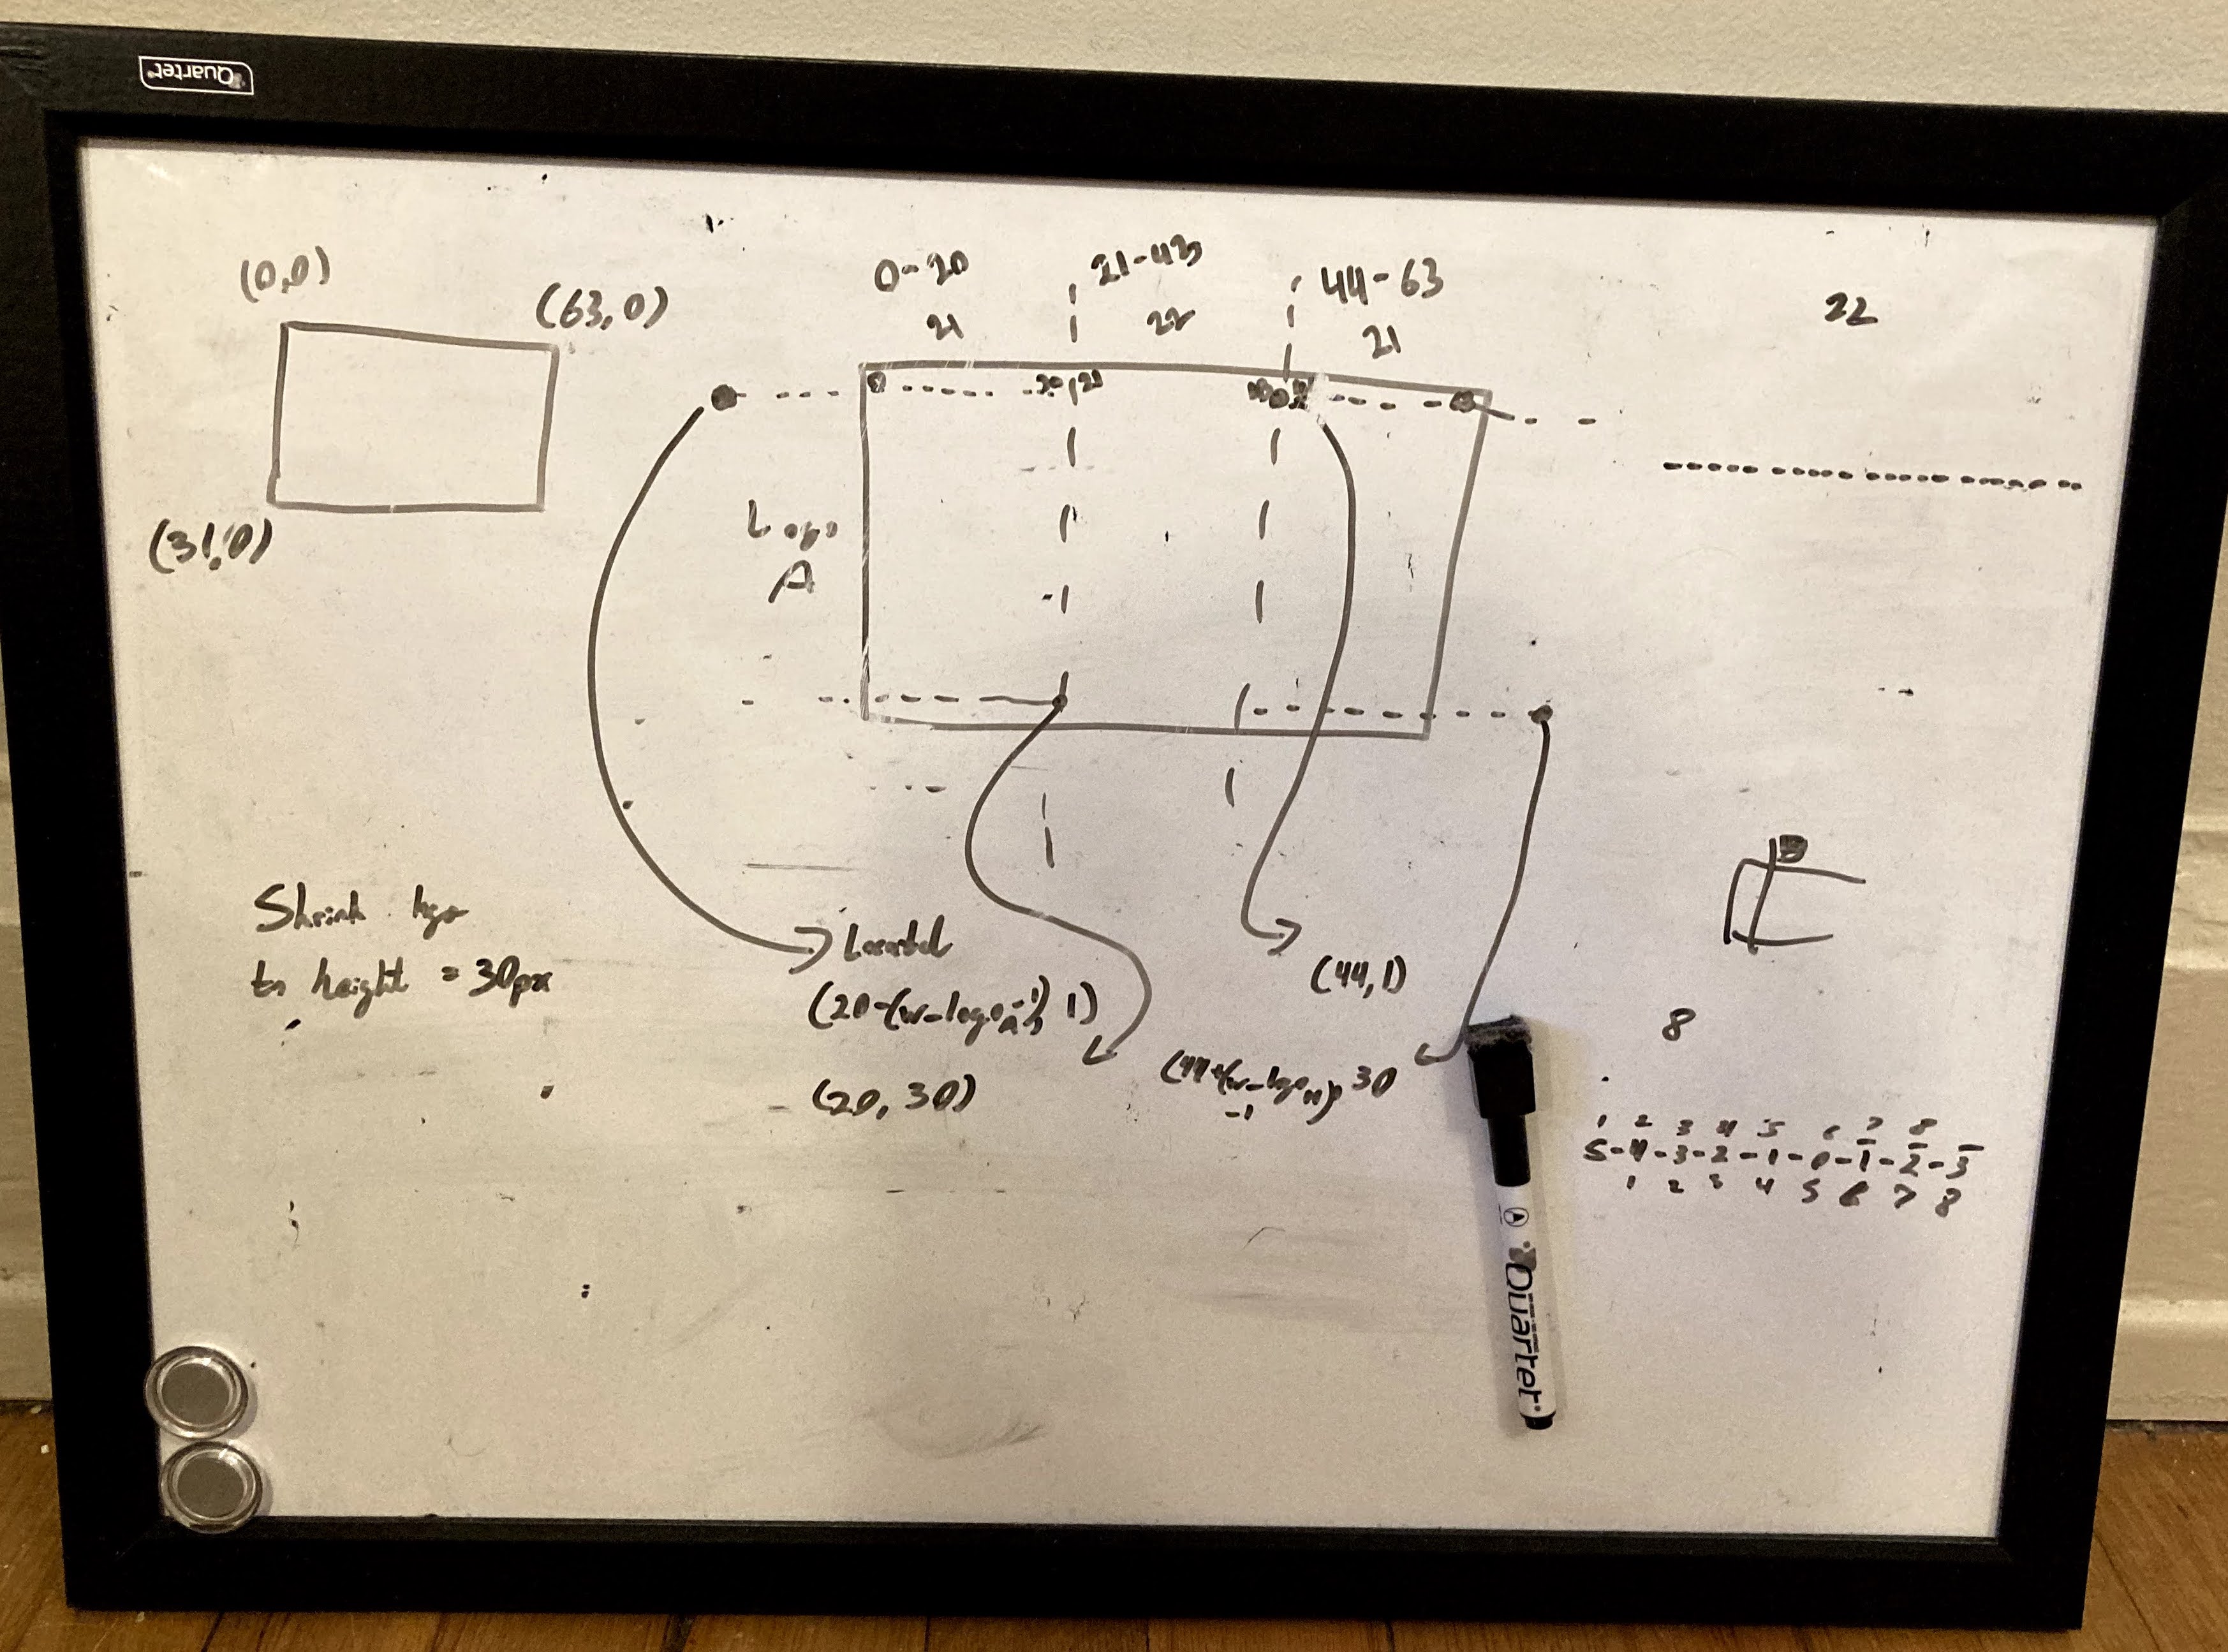
Upon doing some research, I found that a Reddit user by the name of /u/RiffnShred had already completed a very similar project in October 2019. Furthermore, the code for this project was open source and available on GitHub. RiffnShred’s project served as a huge source of inspiration for my own, especially for some graphics layouts. I began sketching what I’d like my scoreboard to look like, both physically and what’s displayed my the matrix. Many whiteboard iterations later and I had a good sense of what I wanted to create. You’ll notice the main screen for games in progress is quite similar – as the old adage goes “imitation is the greatest form of flattery”. You can check out RiffnShred’s repository here.
At this time, I made another rule for myself – I would not copy code from RiffnShred’s project. I wanted this project to be a learning experience, not a copy-paste exercise. Since I’d be building it from scratch, I wanted to figure out how things work with just my knowledge, some Google-fu, and perseverance. This rule may have made the project take longer than it otherwise would have, but I wouldn’t have gained anywhere near the amount of skill in using the NHL API or an LED matrix if I just copied code. Besides, if I was going to copy-paste from RiffnShred’s work, I may have well just ran their project and given up on this whole endeavour.
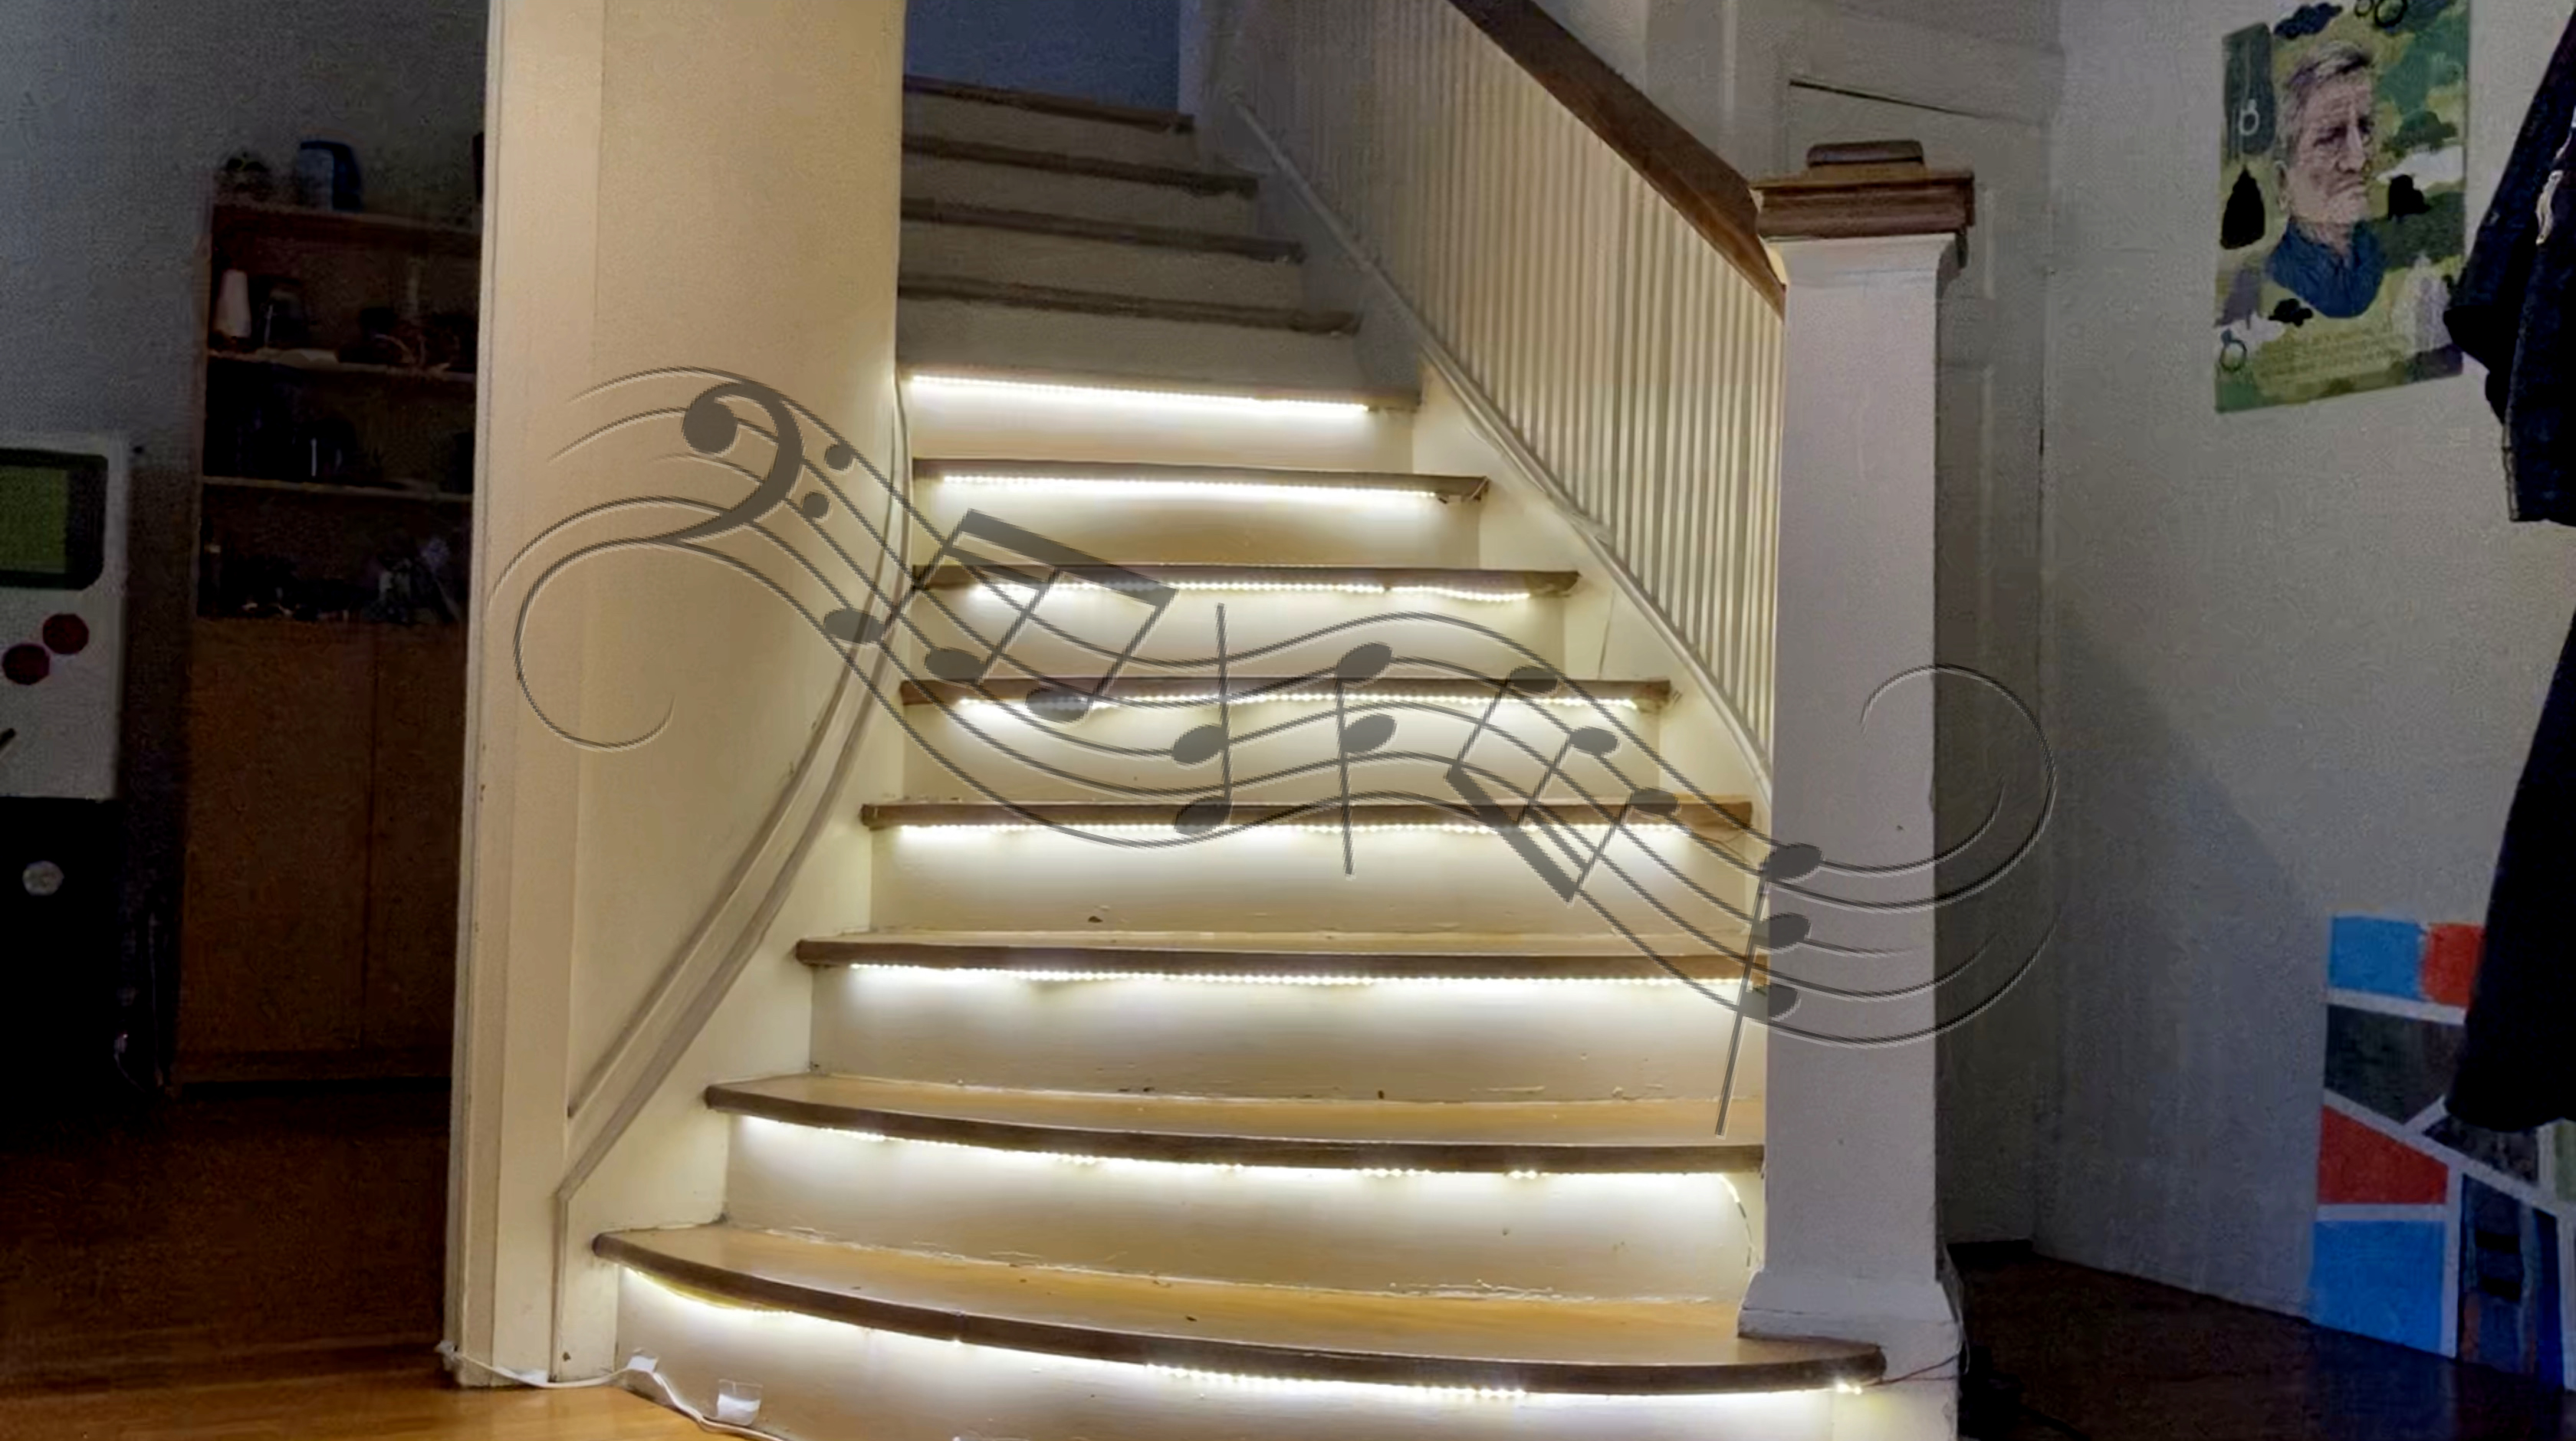
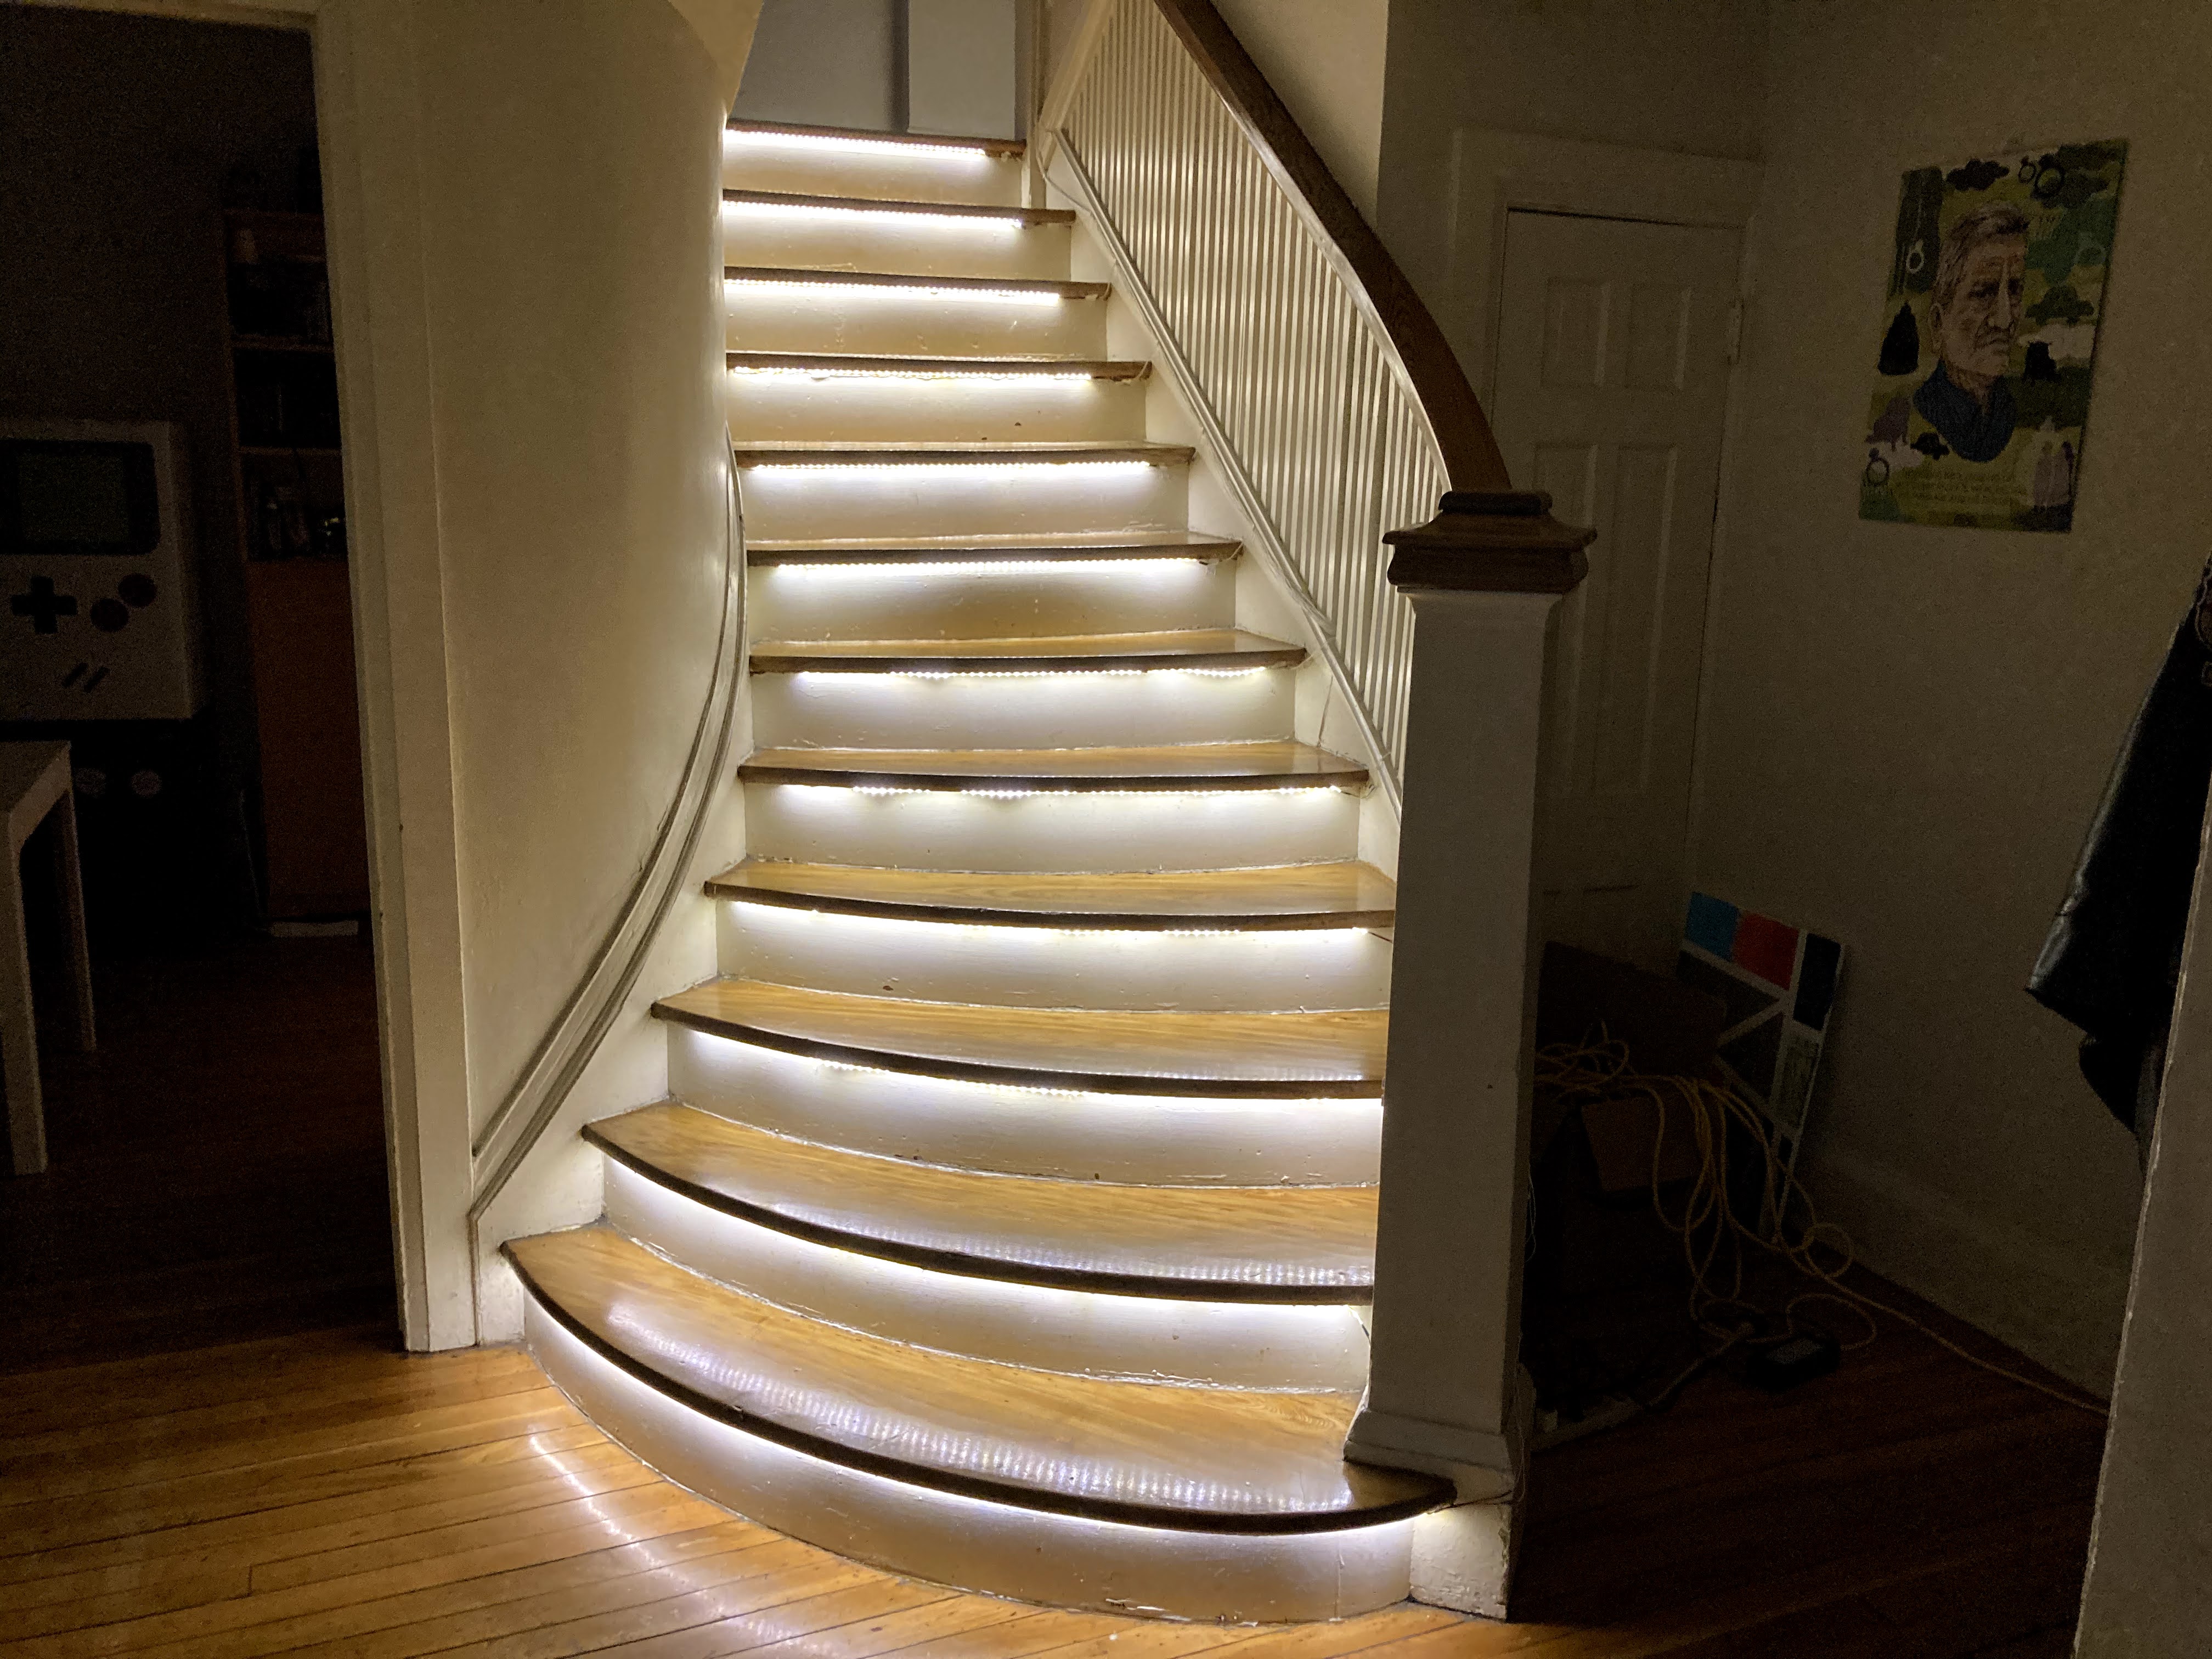
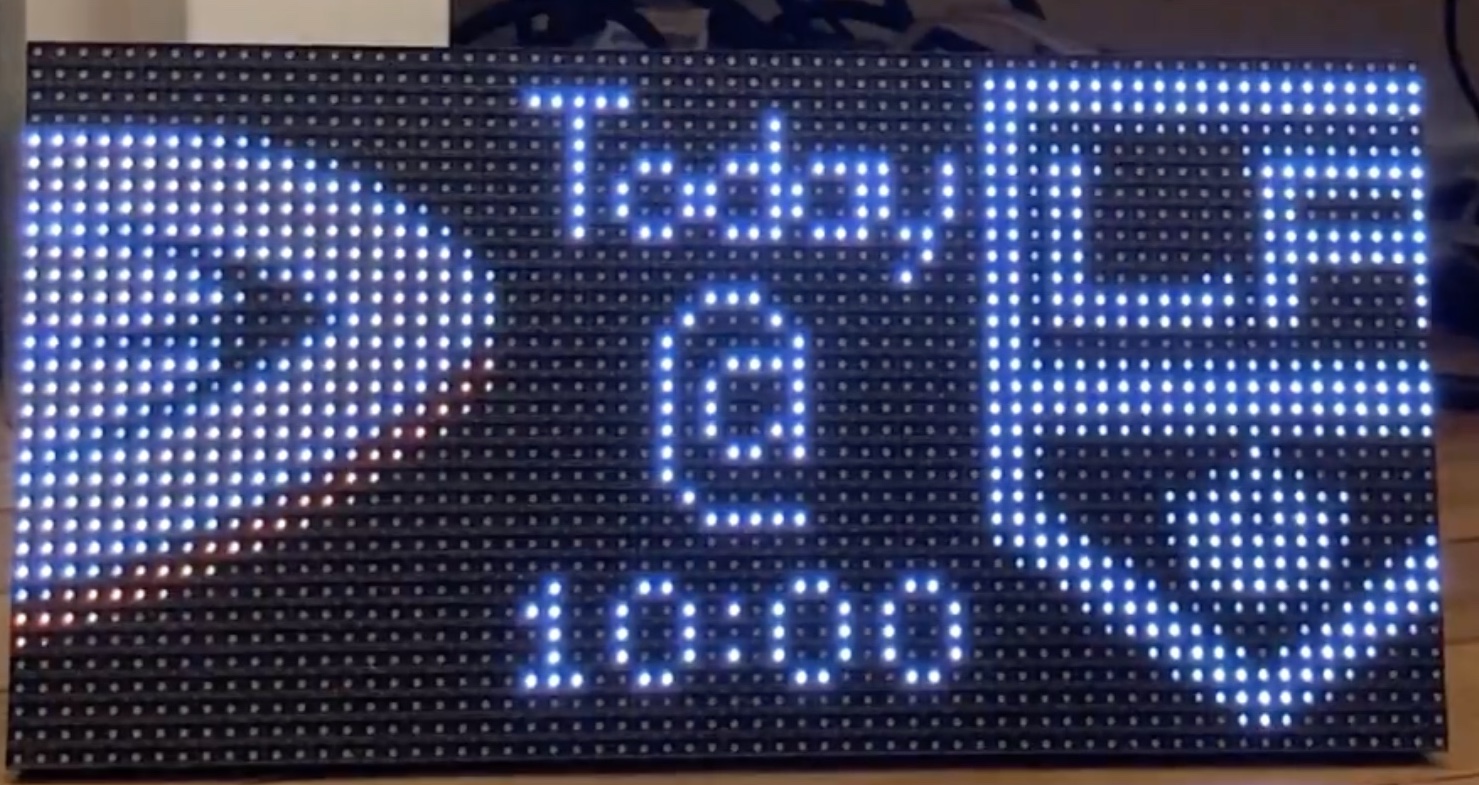
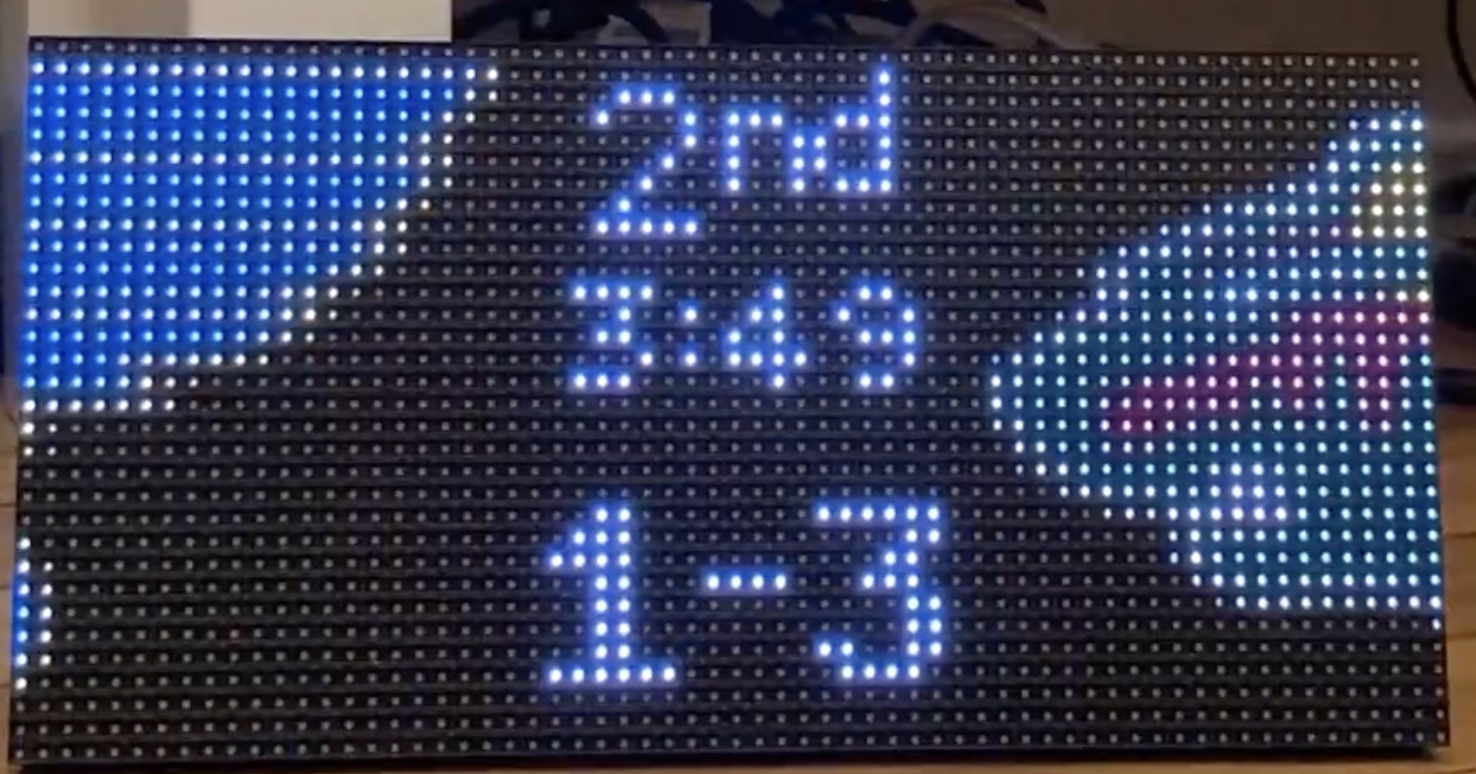
The remainder of this blog post will dive into more details of the project, how it functions at a high level, and technology that makes it all possible. But before then, here’s a looks at the (nearly) finished product.
Hardware
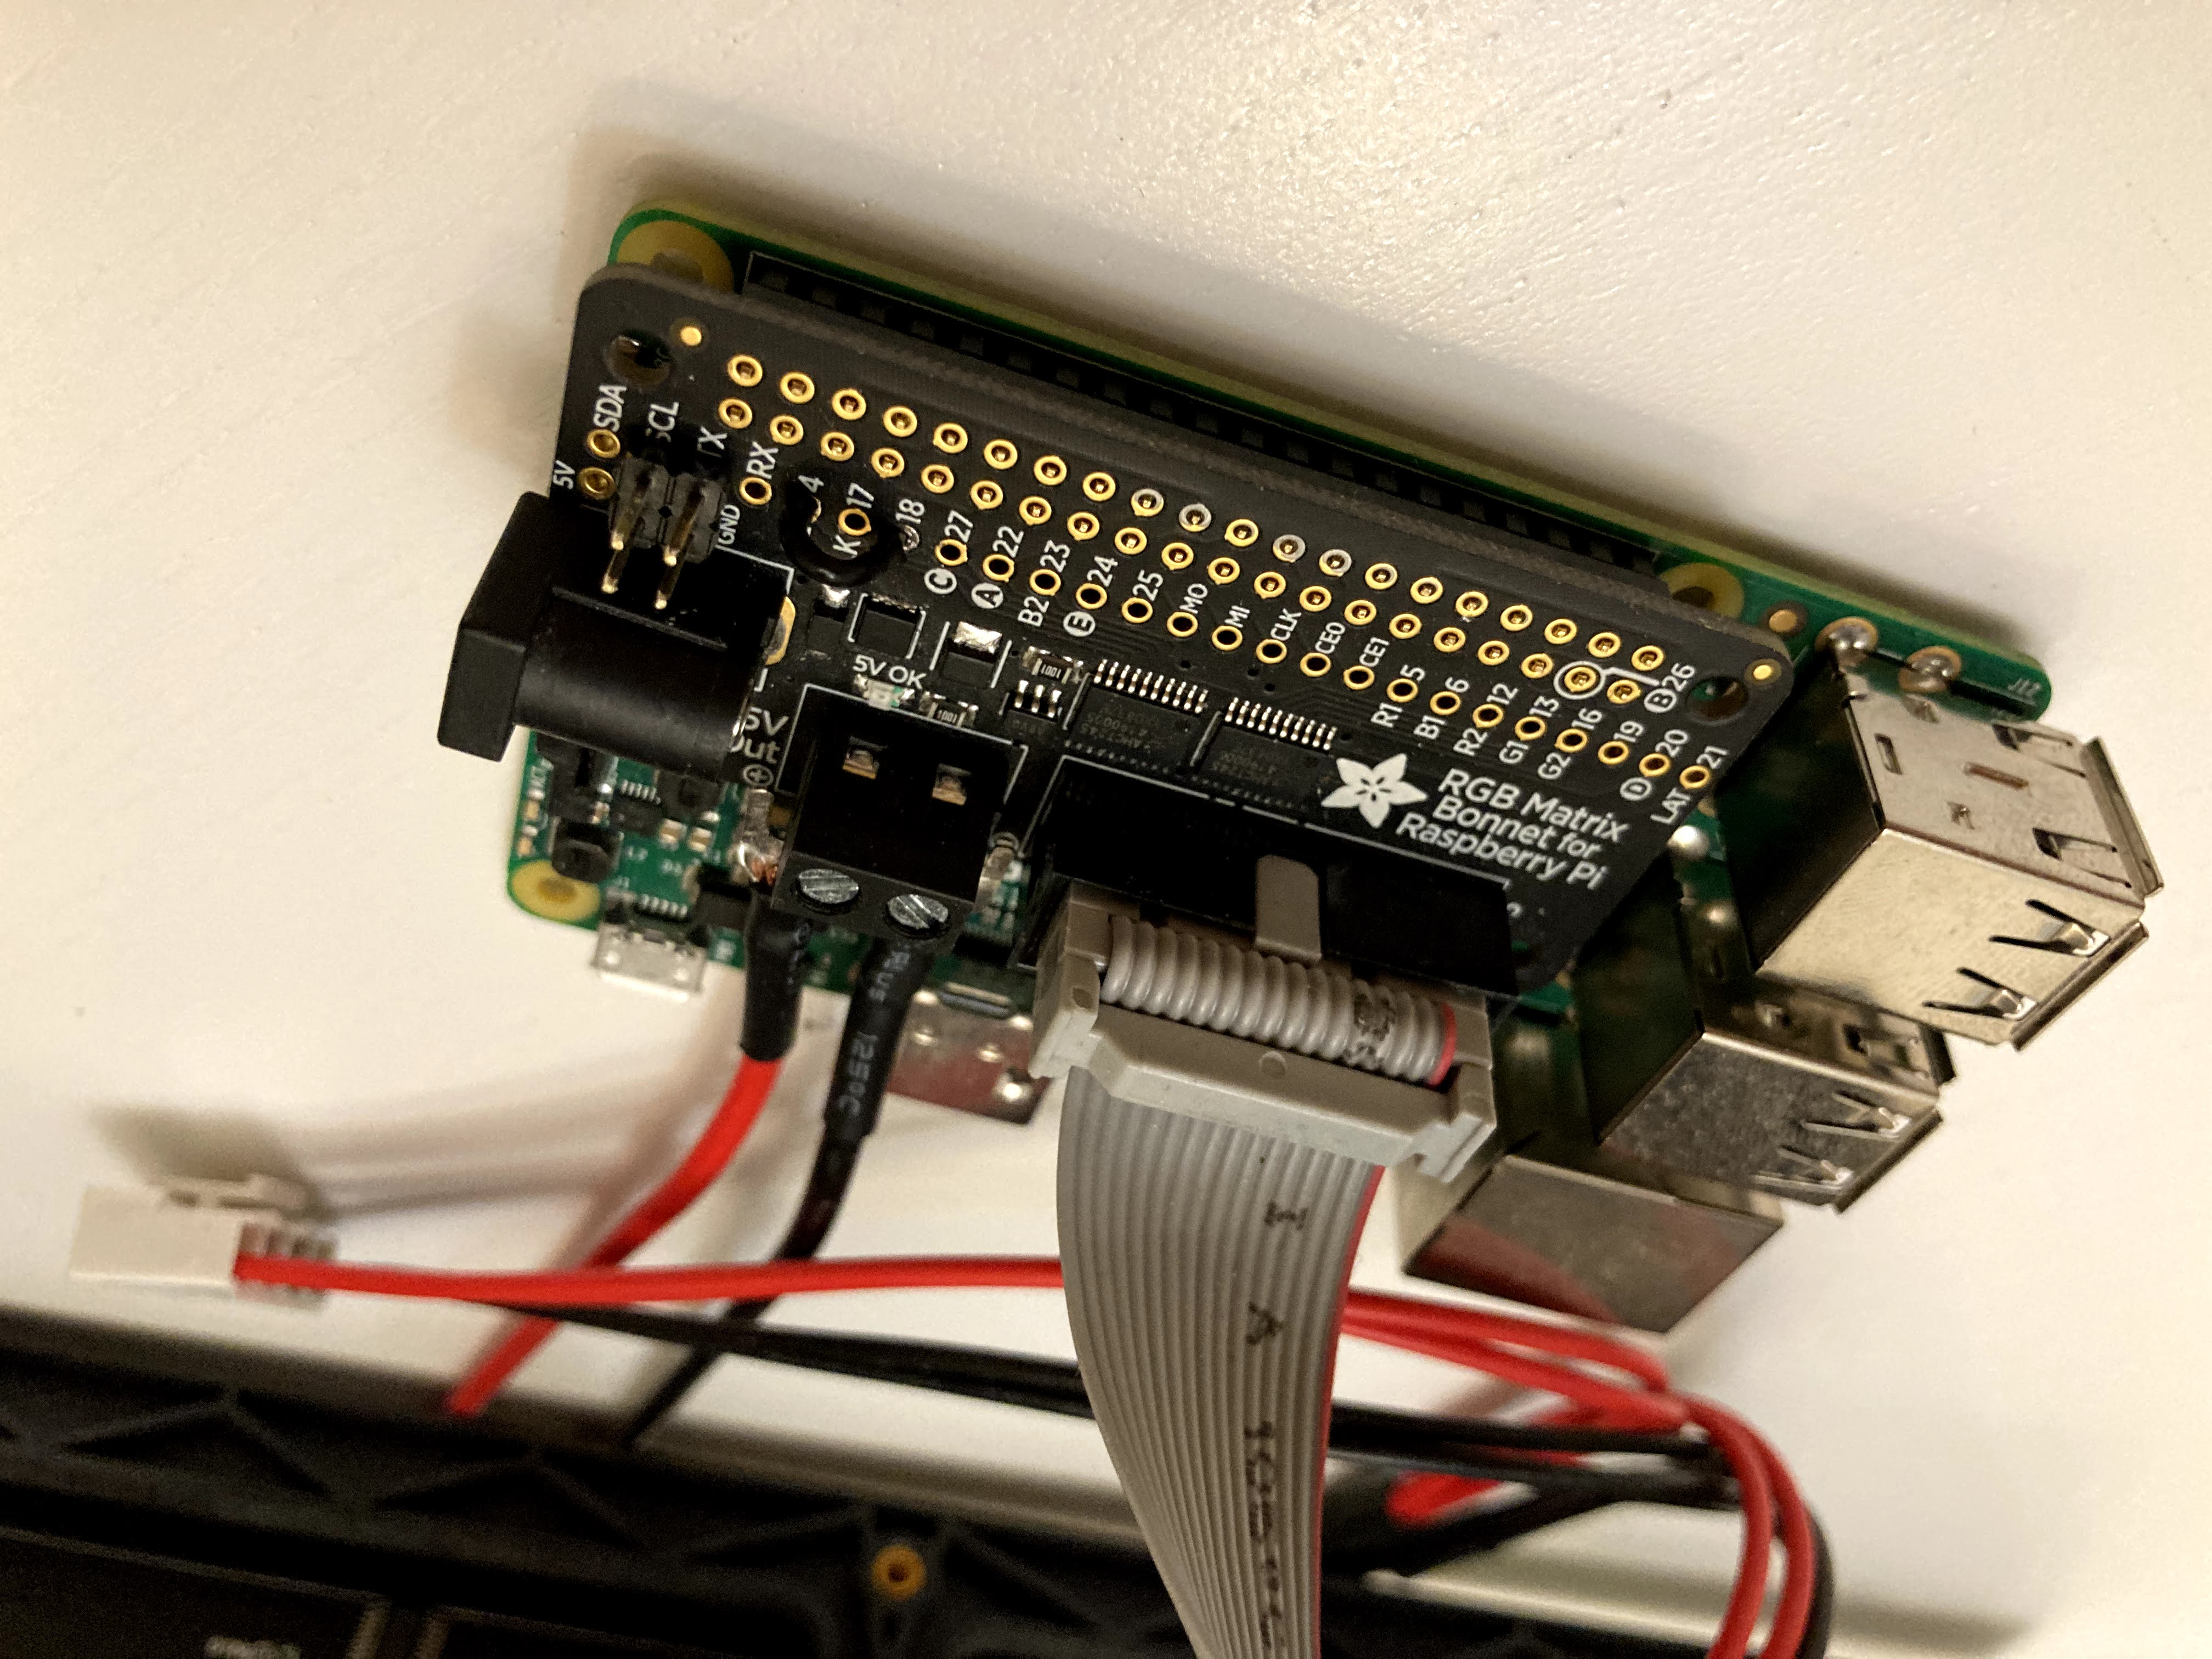
The hardware for this build is very simple. At the heart of the project is a Raspberry Pi 3B. The LED matrix is a 32x64 P4 hub75 matrix that I picked up on AliExpress for ~$20 CAD. Between the Raspberry Pi and the matrix is a Adafruit RGB Matrix Bonnet (this can be purchased from Digikey if you’re outside of the US). This bonnet makes driving the matrix with a Raspberry Pi nearly plug and play (i.e. absolutely invaluable to the project). Powering everything is a 5V 8A power supply, also from AliExpress. And that’s it!
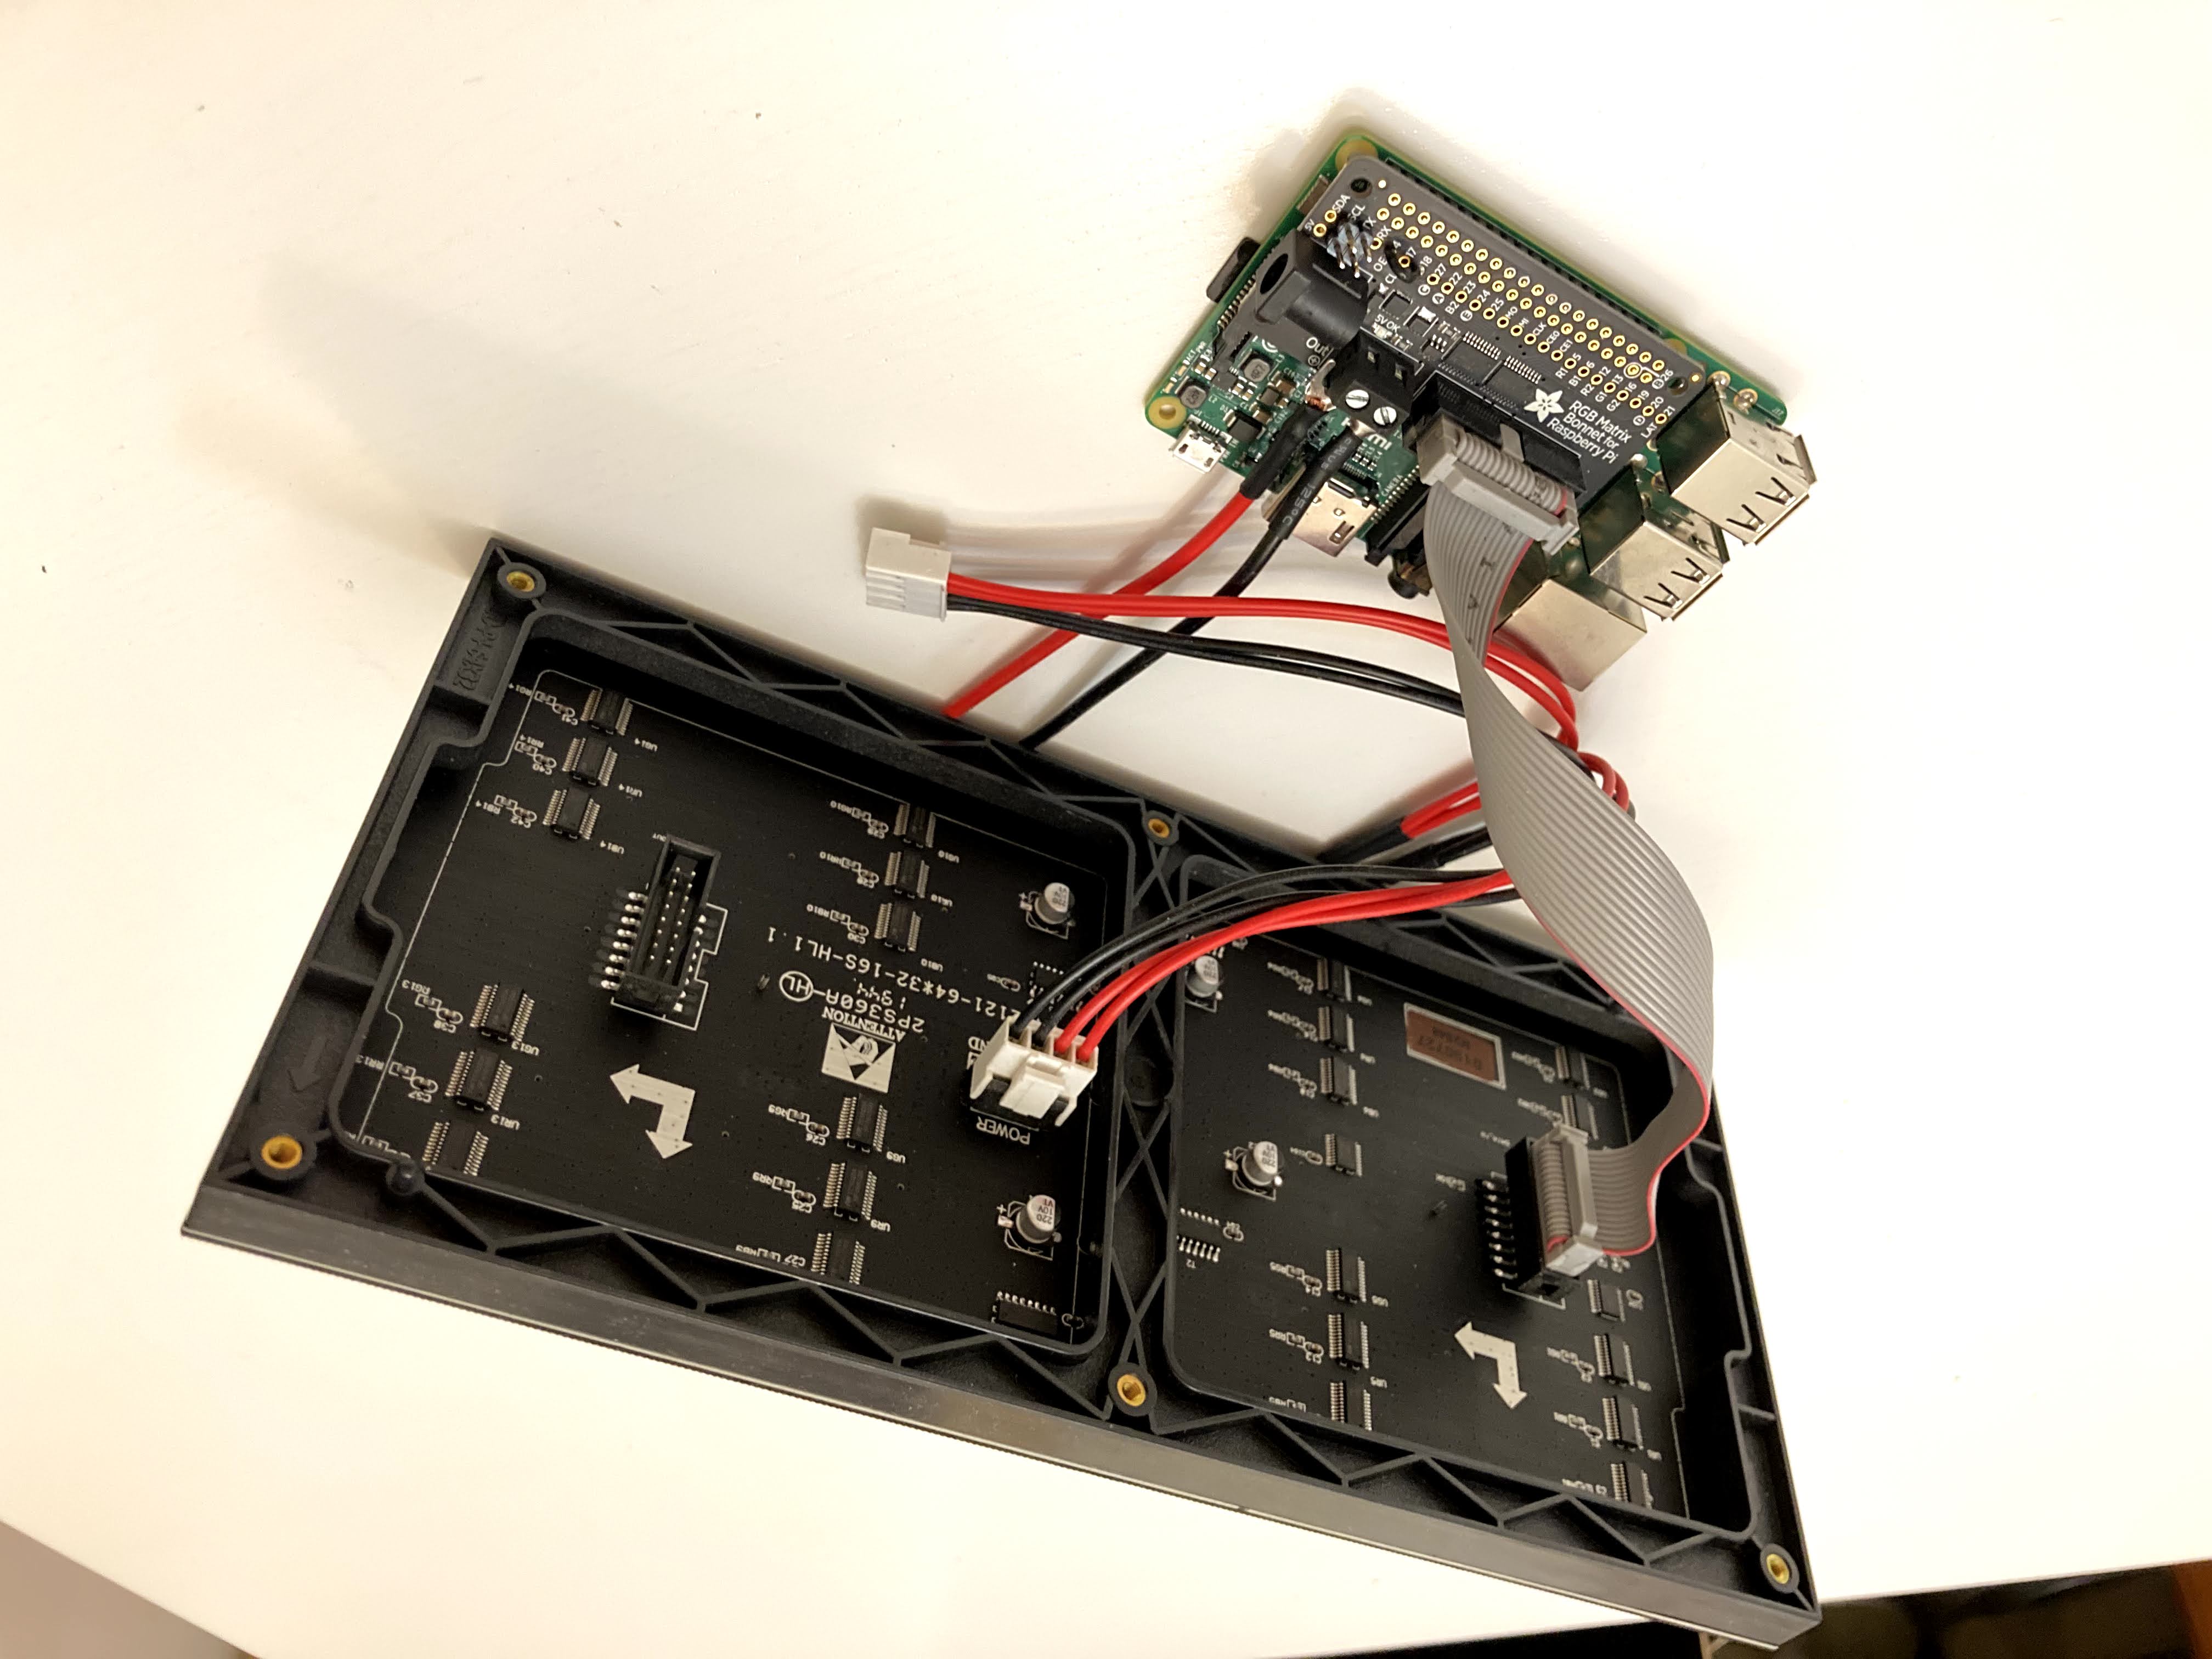
The only interesting part of the hardware is a quick and easy solder job. To use the “quality” option when driving the matrix, a wire needs to be soldered between GPIO pin 4 and pin 18 on the bonnet. This allows the Raspberry Pi to dedicate resources that would normally be for audio output to driving the LED matrix, resulting in much less flicker while the matrix is in operation. You’ll see the quality option enabled in the code during setup with the following line:
options.hardware_mapping = 'adafruit-hat-pwm'
For more information on the hardware needed to drive a matrix with a Raspberry Pi, you can check out Adafruit’s documentation here.
Logic & Software
All code for this project is written in Python 3.8. The basic logic of the scoreboard is very simple. Upon startup, a get request is made to the NHL API. This will return all NHL games & scores for the current day, formatted in JSON. From this, a list of dictionaries is compiled. Each dictionary in this list contains key information for a single game (teams, scores, start time, time remaining, etc.). Based on this key information, an image is built for each game that will be displayed on the matrix. This image differs depending on the state of each specific game. The three most common situations are as follows:
- If they game has not started, the start time of the game in the local time zone will be displayed.
- If the game is in progress, the score and time remaining in the period will be display (this includes intermissions).
- And if the game is over, the final score and end status (if the win was in OT or a shootout) are displayed.
Both team’s logos will also be displayed in all situations. In total, there’s over a dozen different combinations of game statuses that have been accounted for, and due to the COVID-19 pandemic, even postponed games are accounted for! The API’s date rolls over at about 11am EST the next day, so you’ll see last nights scores when you get up in the morning (especially useful for those late west coast games).

Each game in the list is looped through and its image is displayed on the matrix for a few seconds before transitioning to the next image. At the end of the loop, a new API call is made to update the dictionaries, and the loop begins anew. The old list is not discarded though, it’s actually used to determine if a team has scored. If the sore in the updated dictionary is larger than that in the old one, it is shown that the appropriate team has scored by having it’s goal counter appear red for a few seconds before fading back to its normal white.
Images are built using the Python Imaging Library. Each image is built just before it is displayed. That is, in the split second between the fading transitions. This is to negate flicker that is caused by the computations needed to build the image. If the next image was built while something was being displayed on the matrix, some very obvious flickering would occur. Displaying images on the matrix is handled by hzeller’s wonderful rpi-rgb-led-matrix package. This allows you to display images on the matrix and adjust the display settings with ease through it’s simple to use Python bindings. This project truly would have been impossible without it. More info on this package can be found on hzeller’s GitHub.
You’ll notice hzeller’s package being used anytime the options or matrix objects are mentioned within the code.
# Configure options for the matrix.
options = RGBMatrixOptions()
options.rows = 32
options.cols = 64

...

# Define a matrix object from the options.
matrix = RGBMatrix(options = options)

...

# Reset the brightness and display the image.
matrix.brightness = maxBrightness
matrix.SetImage(image)
You can view all my code for this project, along with installation instructions, at my GitHub Repository here.
Next Steps
Now the the offseason is upon us, my focus will shift to making an enclosure for the rear of the LED matrix and the Raspberry Pi, finishing up this iteration of the project. I’m also going to explore adding a photo resistor so the display brightness is determined by the ambient light of the room, rather than the time of day as it currently is.
I’ve also decided that I’d like to make a larger version of this project that will be a gift for a family member, so updating the code and designing and building an enclosure for that will keep me busy in the fall. Eventually I’d like to explore adding scores for other sports as well, making the scoreboard a little more of a “jack of all trades” per-say (and make it less useless in the hockey offseason). I may publish a follow-up to this post once these new features get implemented.
Overall, I’m super pleased with how this project turned out. I’m even more pleased with the set of skills I learned along the way. This project makes use of so many technologies that I had no prior exposure to. Driving LED matrices, harnessing a real-time score API, leveraging the Python Imaging Library, and more! I’m thrilled that I was able to build those skills through this project. More tools in the proverbial toolbox.
If you have any questions about any part of this project, feel free to shoot me an email at stephen@gidge.dev. I hope this makes you think of some ideas of your own that combine multiple of your hobbies. I’d love to see them! Thanks for reading!
Cheers,
Stephen
LinkedIn Reddit Facebook Twitter